Customer Intelligence
What's a good return customer rate, and how do I improve mine?
There's no single number. A good return customer rate beats your own baseline and fits how often people need what you sell. Here's how to calculate yours and move it.
- Published
- Author
- AccessFuel Team
- Reading time
- 4 min read
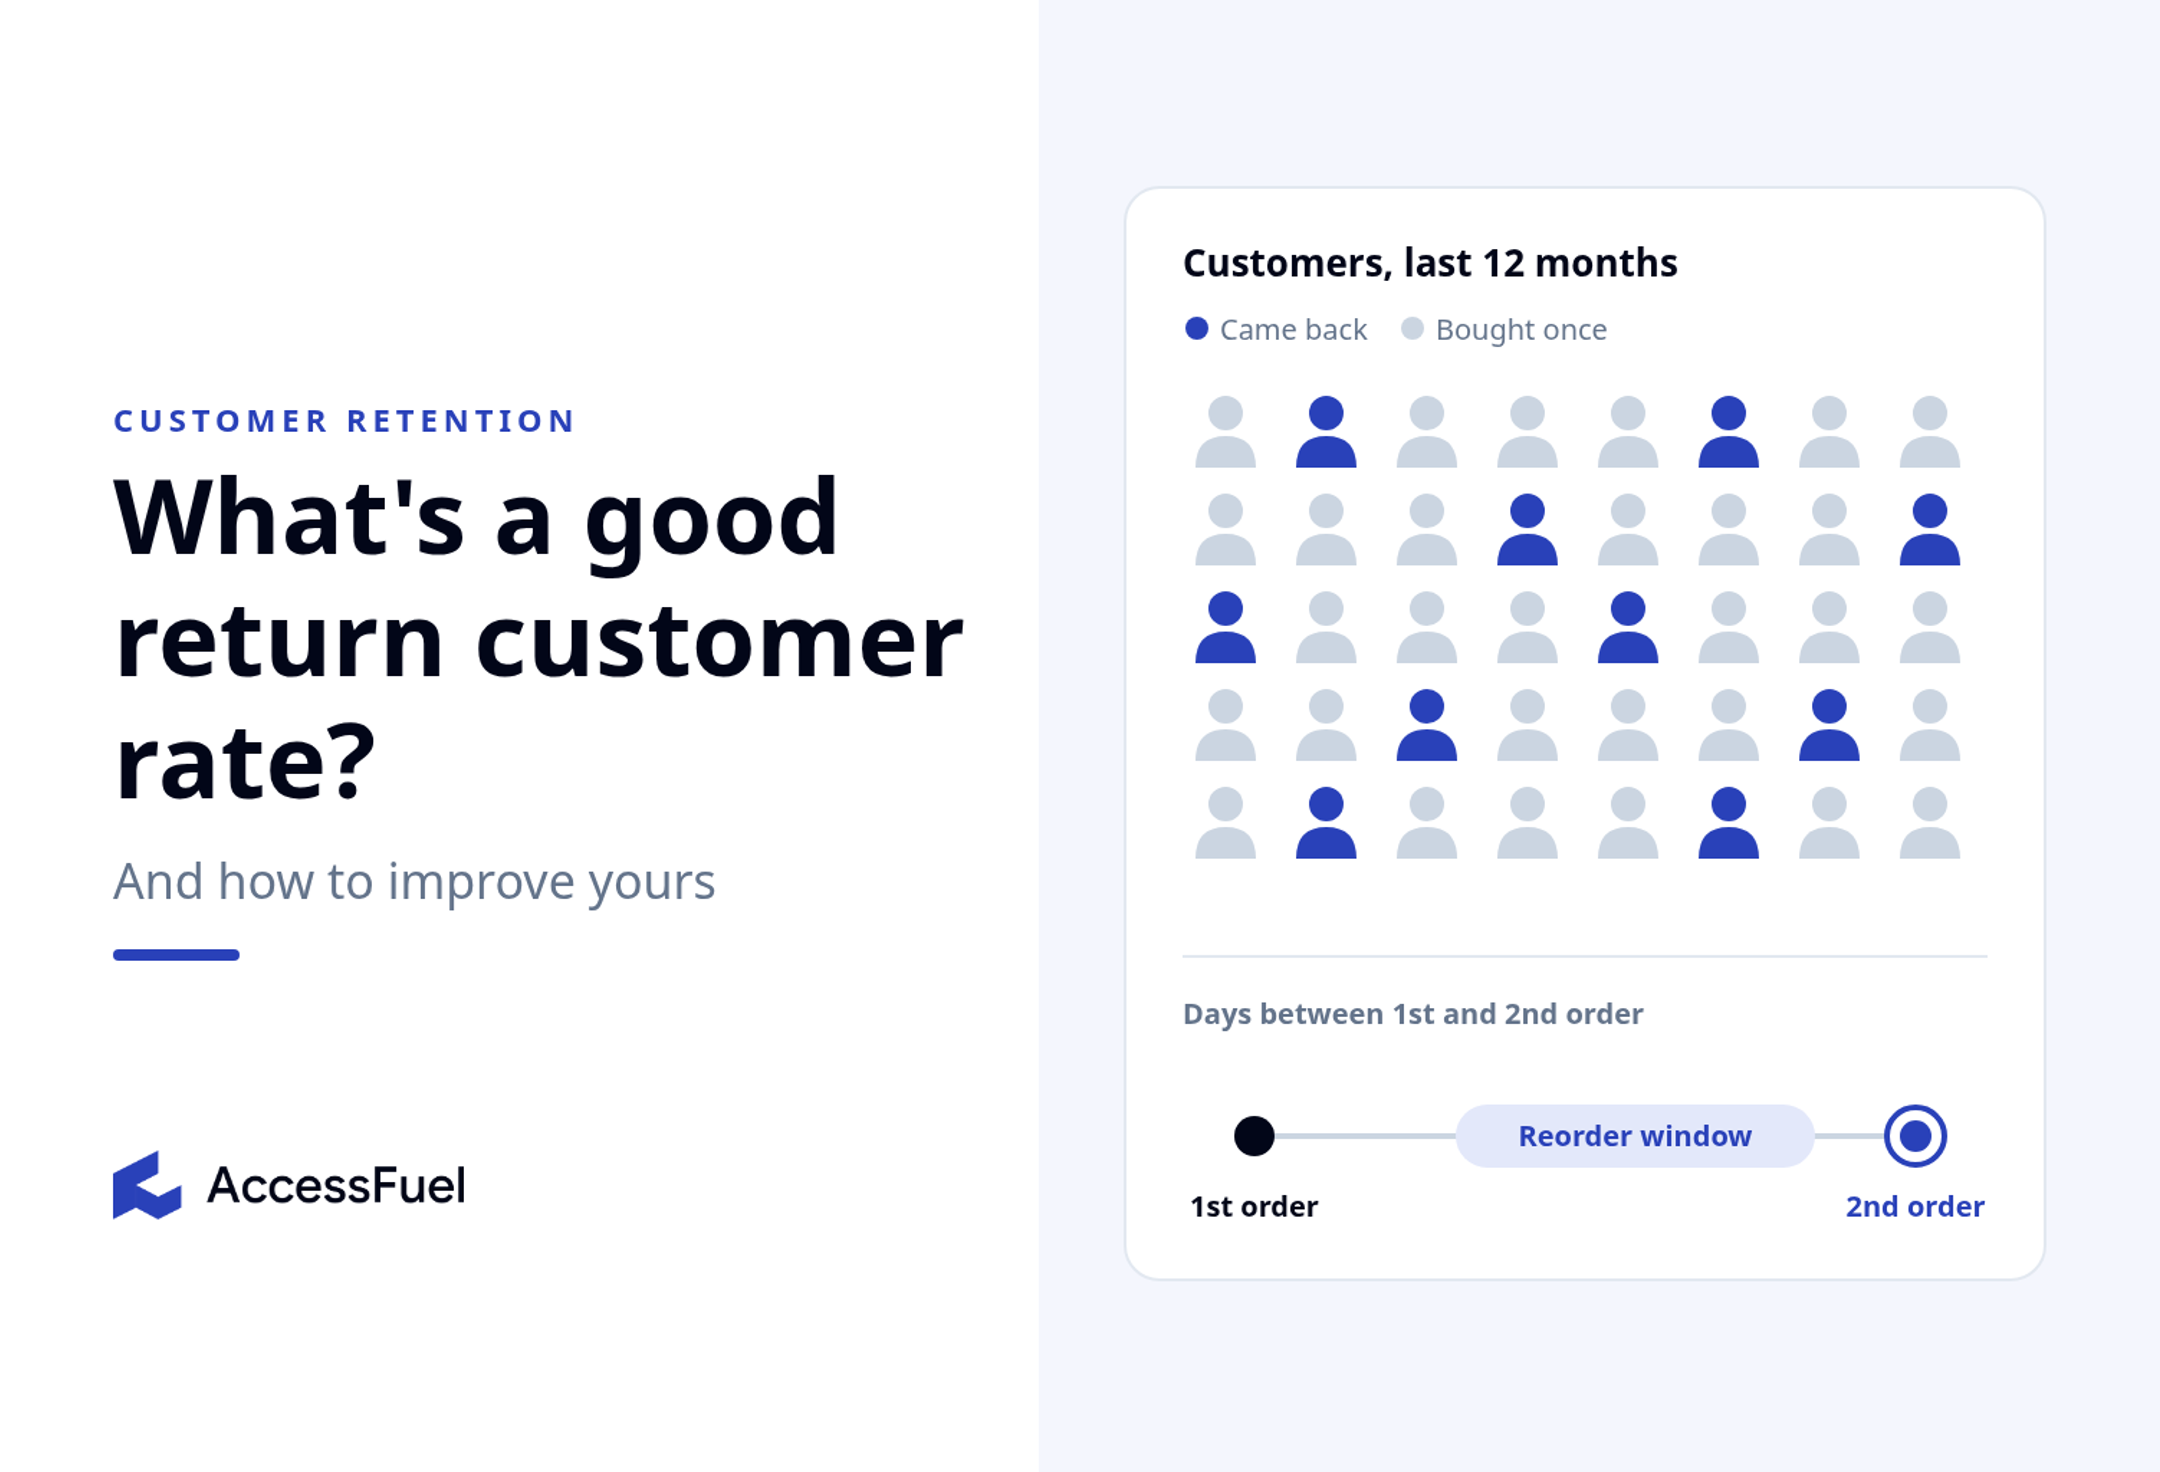
There's no single number. A good return customer rate is one that beats your own baseline and fits how often people actually need what you sell.
A coffee brand and a mattress brand shouldn't be graded on the same curve. One sells something that runs out in three weeks. The other sells something that lasts a decade.
You still want a reference point, though. Across ecommerce, a return customer rate in the 20% to 30% range is often cited as typical. Treat that as directional, not a standard. If you sell consumables and you're under it, you've likely got a retention problem. If you sell sofas, you might be right where you should be.
Here's how to calculate yours, read it honestly, and move it.
How to calculate your return customer rate
Return customer rate is the percentage of customers in a given period who placed more than one order.
Return customer rate = (customers with 2+ orders ÷ total customers) × 100
Say 4,000 people bought from you in the last 12 months and 1,000 of them ordered more than once. Your rate is 25%.
Simple math. The inputs are where it gets messy.
- Your window changes everything. A 30-day rate and a 12-month rate for the same store can look like two different businesses. Match the window to your natural reorder cycle.
- Duplicate profiles hide repeat buyers. One shopper with a work email and a personal email shows up as two one-time customers. Your rate drops and nothing actually changed.
- Guest checkout splits people up. Same problem, different cause.
- Labels vary by tool. Shopify calls it returning customer rate. Other tools say repeat customer rate or repeat purchase rate, and some measure the share of orders instead of the share of customers. Check the definition before you compare dashboards.
What's a good return customer rate for your category?
Your category sets the ceiling. Use this as a gut check, not a scorecard.
| Category | Typical reorder cycle | What "good" looks like |
|---|---|---|
| Consumables (coffee, supplements, pet food, skincare) | Weeks | A big share of buyers should come back. A low rate usually points to a product or experience problem. |
| Apparel and accessories | Seasonal | Moderate. Watch second-order timing around drops and season changes. |
| Gifts and occasion products | Yearly | Lower. Measure on a 12 to 18 month window. |
| Durable goods (furniture, mattresses, bikes) | Years | Low by nature. Track accessories, add-ons, and referrals instead. |
The benchmark that matters most is your own trend. Pull your rate for each of the last four quarters using the same window. If it's climbing, keep going. If it's flat or falling, the rest of this post is for you.
Why the second order is the one to watch
For a lot of brands, the hardest order to earn is the second one. Don't take that on faith. Check your own data: what share of first-time buyers came back at all, and what share of second-time buyers came back for a third?
If the first number's much lower, your growth problem lives between order one and order two.
While you're in there, find your median days between first and second order. That number is your real reorder window. Most of the tactics below depend on it.
6 ways to improve your return customer rate
- Time follow-ups to your actual reorder window. If your median second order lands at day 41, a generic day-30 "we miss you" email is early for some people and late for others. Build the flow around your number.
- Make the first post-purchase emails useful. How to use it, how to get more out of it, what pairs well with it. Selling can wait. Our breakdown of Klaviyo post-purchase flows goes deeper.
- Find your best entry products. Look at which first purchases lead to second orders. Some products create regulars. Others create one-and-done shoppers. Put acquisition spend behind the first group.
- Clean your customer data before you judge the number. Merge duplicate profiles and tie guest orders back to known customers. You can't fix a rate you can't measure.
- Catch slipping regulars early. Someone who orders every six weeks and hasn't ordered in ten is telling you something. Reach out before they're gone.
- Stop discounting everyone. Blanket offers train people to wait for the next code. Save incentives for customers who are past their usual window.
Return customer rate FAQ
Is return customer rate the same as customer retention rate?
Close, but no. Retention rate usually tracks how many customers from a starting group are still active at the end of a period. Return customer rate tracks how many customers in a period bought more than once.
How often should I check it?
Monthly for the trend, quarterly for decisions. Keep the window consistent so you're comparing like with like.
What's a bad return customer rate?
One that's falling quarter over quarter, or one that sits well below what your category's reorder cycle would suggest.
Where AccessFuel fits
Calculating one return customer rate takes an export and five minutes. Calculating it by entry product, by persona, and by acquisition channel, then spotting who's past their reorder window, takes days of spreadsheet work most teams don't have.
That's the work AccessFuel's team takes on. Connect your store and email data, and you can ask AIRA questions like "What's my return customer rate by Customer Persona?" or "Which repeat buyers are past their usual reorder window?" with answers drawn from your Golden Database.
And if you never sign up, the math above still works. Run it this week.
Related posts
Keep Exploring
Discover more insights, strategies, and updates from AccessFuel.
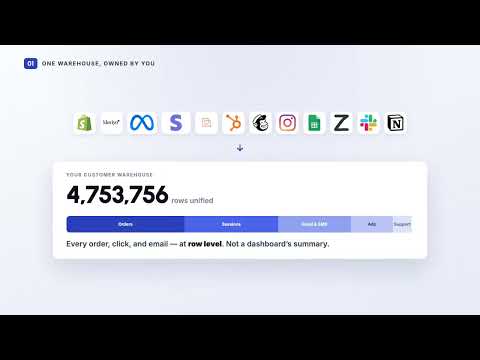
4 min read
Data & AnalyticsIs Ecommerce Analytics Consulting Worth It, or Are You Buying a Deck That Goes Stale?
Consulting is worth it when the work is genuinely one-time, and stops being worth it the moment you need the same answer next month. An honest three-way comparison.
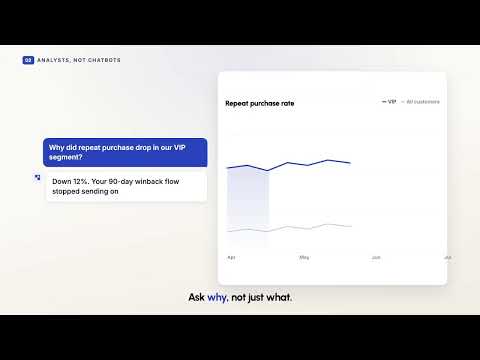
4 min read
Customer IntelligenceWhy Does One Buyer Look Like Five People?
One customer, five systems, five different versions of her. Customer data integration is what turns those blind systems into one that can see, and getting it wrong breaks everything downstream.

4 min read
Customer IntelligenceCustomer Intelligence: Why Can't 30 Tools Answer One Simple Question?
Most ecommerce brands run 30 or more tools and still cannot say why repeat purchases dropped last month. Customer intelligence is the layer that closes the gap between them.