The 10 Questions Ecommerce Stores Should Be Asking Their Data
Most ecommerce brands have more data than they know what to do with. That's not the problem.

The problem is they're not asking it anything.
They're logging in to dashboards. Pulling reports. Watching numbers move. But they're not interrogating the data — they're just observing it. And observation without interrogation is how brands sleepwalk into stagnant growth, bloated ad spend, and a customer base they don't actually understand.
The brands that compound — that grow with precision and retain with intention — don't just have data. They have questions. Sharp, uncomfortable, specific questions that force the data to tell the truth.
Here are the 10 you should be asking.
Q1. Who are our best customers — and what do they have in common?
Not your highest-spending customers. Not your most recent. Your best — the ones with high lifetime value, high purchase frequency, and low acquisition cost. These customers exist inside your data right now. Most brands have never formally identified them.
When you isolate this cohort, patterns emerge: traffic source, first product purchased, geographic cluster, even the time of year they converted. These patterns are the blueprint for acquisition. If you don't know who your best customers are, you can't systematically go get more of them.
What to look for: RFM segmentation — Recency, Frequency, Monetary value. Champions and Loyal segments are your growth engine.
Q2. What is our true Customer Acquisition Cost — by channel?
Blended CAC is a comfortable lie. It smooths over the reality that some channels are efficient and others are hemorrhaging budget. When you break CAC down by channel — paid social, paid search, email, organic, referral — you see the actual cost of each customer relationship before it starts.
The insight isn't just "which channel is cheapest." It's which channel produces customers with the highest downstream value. A channel with a 2x higher CAC might produce customers with 4x the LTV. That's not expensive — that's smart.
What to look for: CAC by channel and the LTV:CAC ratio for each source. Anything above 3:1 is healthy. Below 1:1 is a leak.
Q3. What is the repurchase rate — and where does it break?
First-time buyers are the most expensive customers you have. If they don't return, your business is essentially a single-transaction machine. Repurchase rate is the hinge metric — the number that separates a sustainable ecommerce brand from a perpetual acquisition treadmill.
But the repurchase rate alone doesn't tell you enough. You need to know where it breaks: Is it after order one? After order two? Is there a specific product that acts as a loyalty catalyst — a "gateway SKU" that dramatically increases the probability of a second purchase?
What to look for: 30/60/90-day repurchase rate by product, segment, and acquisition channel.
Q4. What does our revenue actually look like — net of returns and discounts?
Top-line revenue is a vanity metric if you haven't backed out returns, refunds, and promotional discounts. Some brands are operationally profitable at $10M gross — and structurally unprofitable at the same number net. Returns and discount depth vary wildly by product category, season, and customer segment.
This question forces you to calculate net revenue contribution — the only number that tells you what the business actually earned.
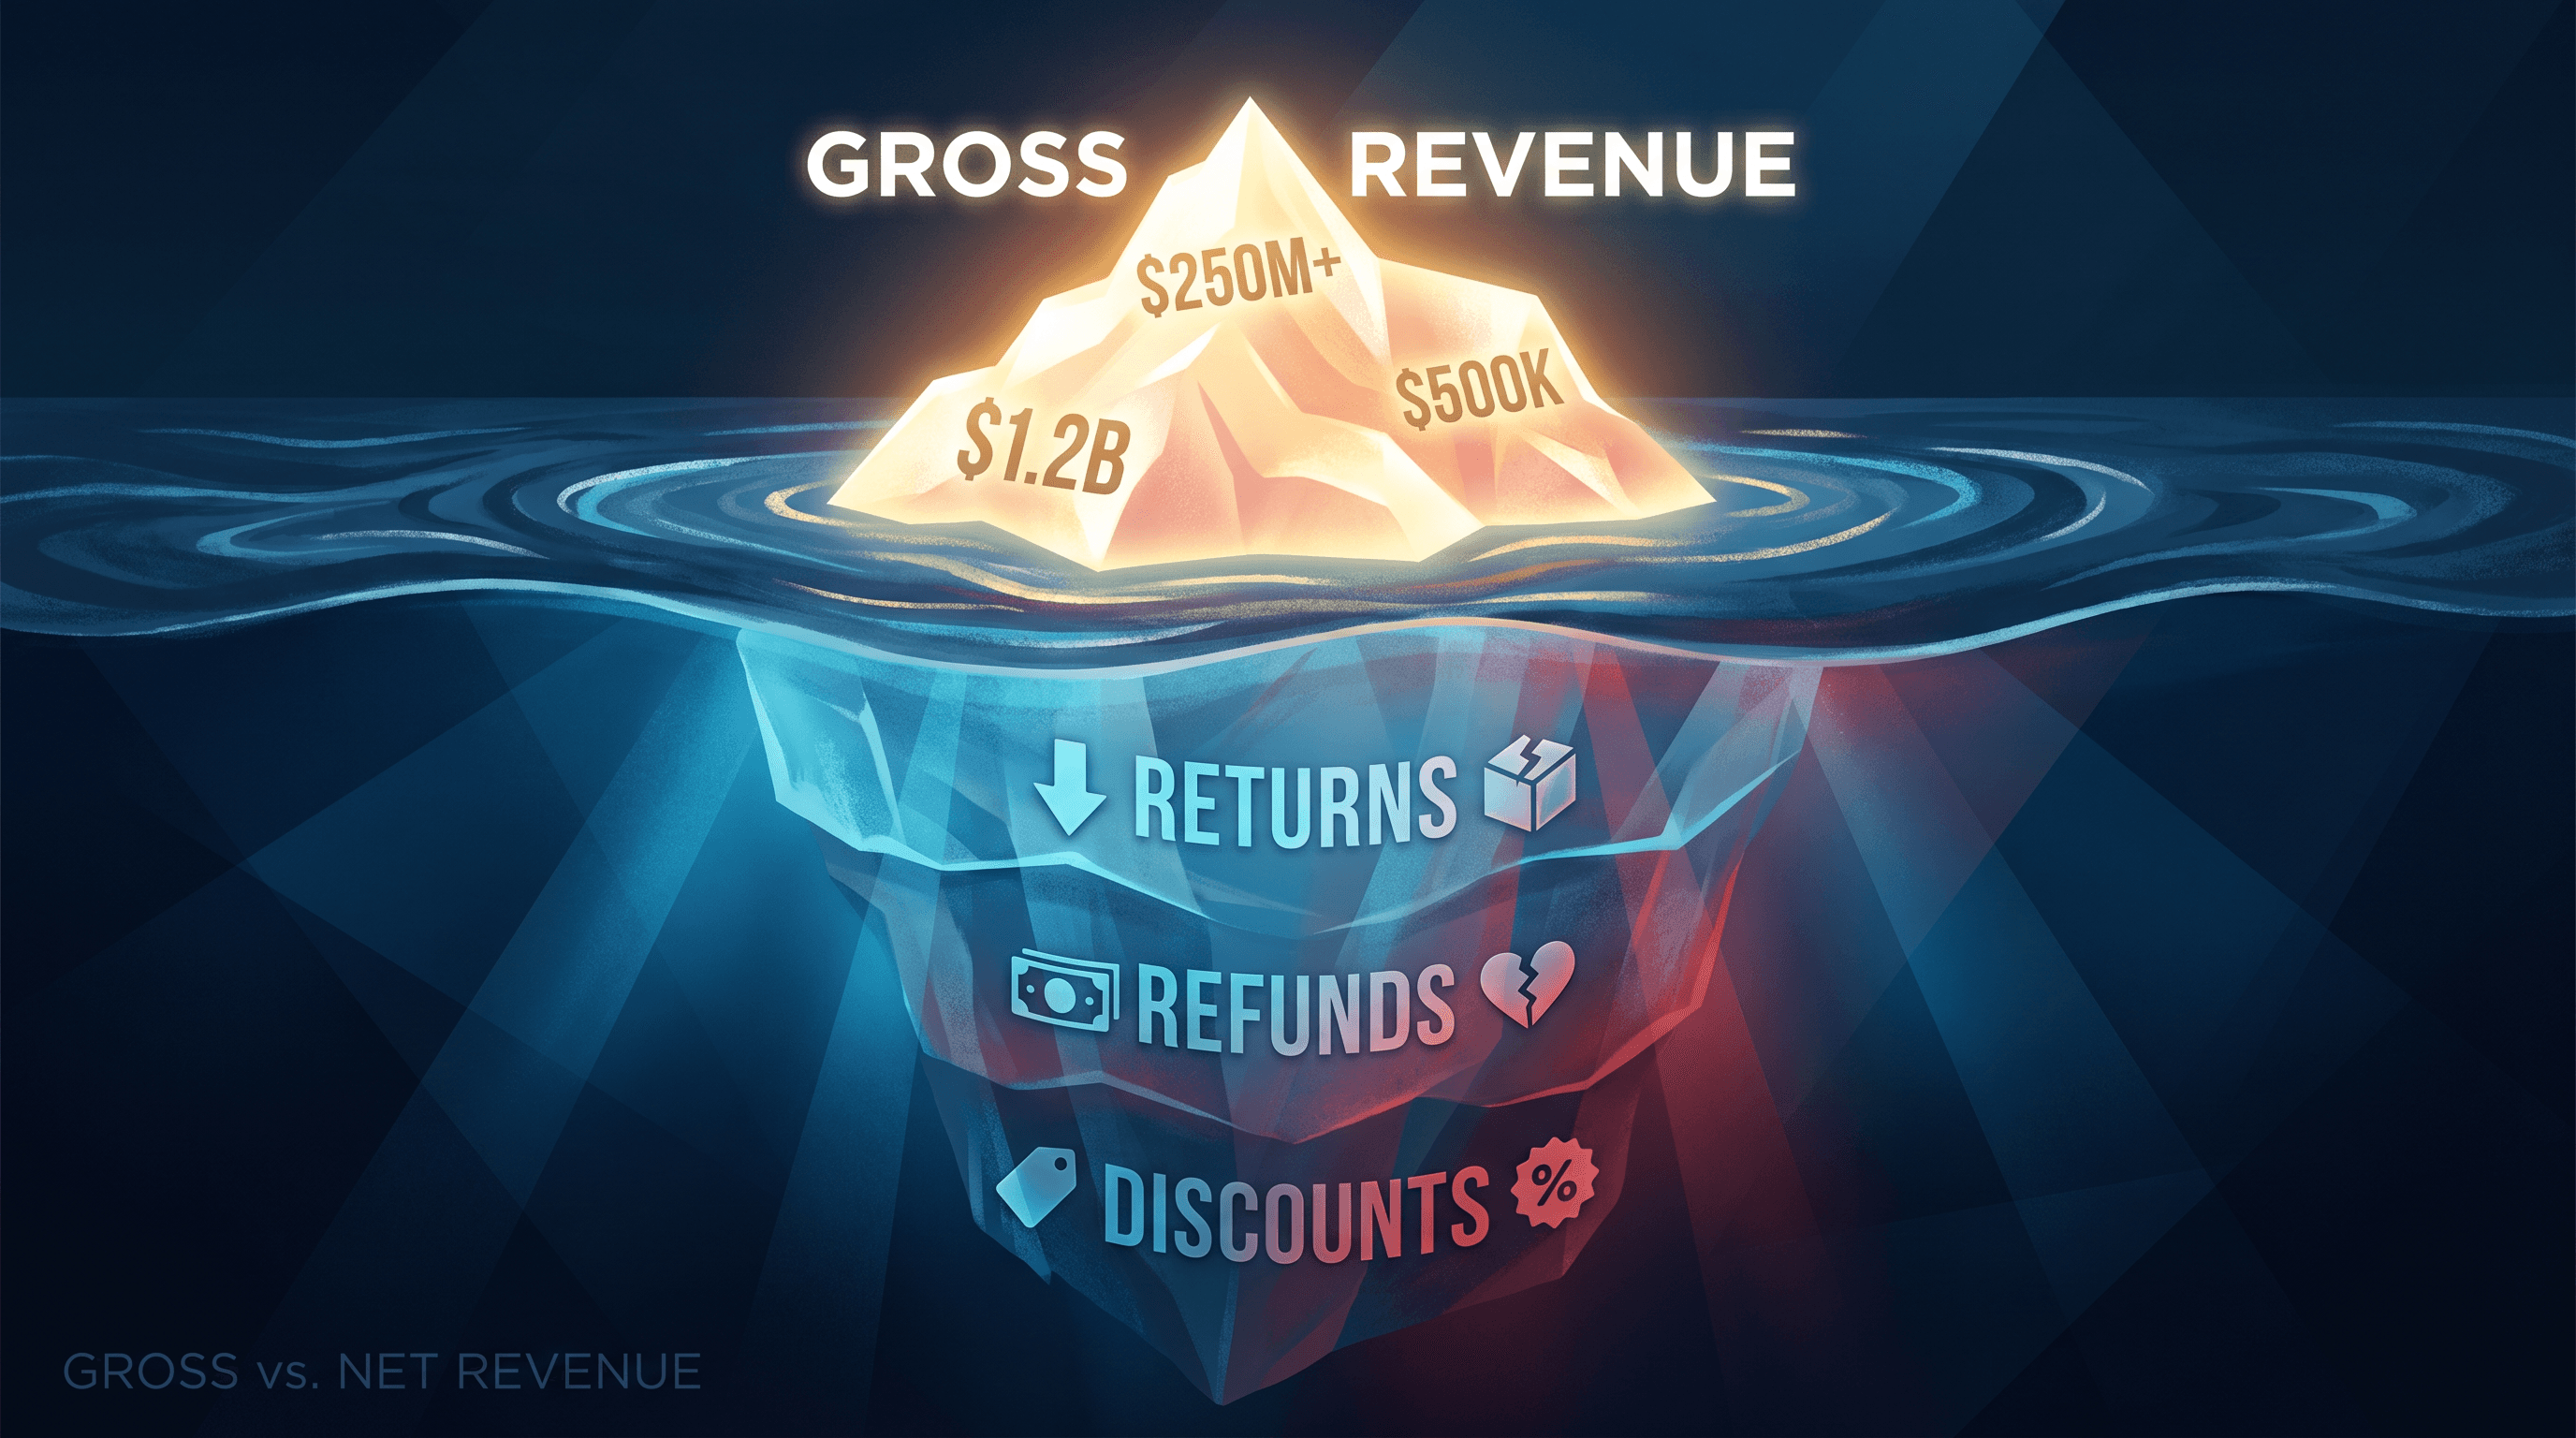
What to look for: Gross vs. net revenue by product line, return rate by SKU, discount utilization rate across segments.
Q5. Is our Average Order Value growing — and are we engineering it?
AOV is one of the most directly engineerable metrics in ecommerce. Bundles, cross-sells, minimum thresholds for free shipping, tiered pricing — these are all AOV levers. But most brands treat AOV as something that just happens, not something they drive.
The question isn't just "what is our AOV?" — it's "what is our AOV ceiling, and are we building toward it?" If your top 10% of orders by value have a specific composition (e.g., product X + product Y), that combination is a merchandising signal you're likely not acting on.
What to look for: AOV trend over time, AOV by traffic source, product affinity pairs that drive AOV above average.
Q6. Which products are silent killers — high revenue, low margin?
The bestseller list is seductive. But revenue rank and margin contribution are often inversely correlated. You may have a top-5 SKU that drives 18% of your gross revenue and 4% of your net margin. Meanwhile, a "mid-tier" SKU is quietly doing the opposite.
This question surfaces the margin architecture of your catalog — and exposes the products that look like assets but behave like liabilities.

What to look for: Contribution margin by SKU, not just gross margin. Factor in return rate, fulfillment cost, and promotional frequency.
Q7. What does our cohort data tell us about revenue trajectory?
Cohort analysis is the closest thing ecommerce has to a crystal ball. When you group customers by the month or quarter they first purchased and track their cumulative revenue over time, you get a clear picture of whether the business is getting better or worse — independent of volume.
If your 2023 cohorts are generating more revenue at month 12 than your 2024 cohorts, that's a structural signal. Maybe acquisition quality declined. Maybe the product mix shifted. Maybe retention programs weakened. The cohort chart doesn't lie.
What to look for: Revenue-per-cohort curves plotted at 3, 6, 12, and 24 months. Healthy cohorts curve upward. Declining cohorts flatten or drop.
Q8. Where in the funnel are we losing the most value?
Most ecommerce brands obsess over top-of-funnel acquisition and checkout conversion — and ignore the massive middle. Abandoned cart rates, product page bounce rates, upsell decline rates, and post-purchase email open rates all represent value that entered the funnel and didn't exit through purchase.

A funnel audit isn't just about conversion rate optimization. It's about understanding where the handoff breaks — where your customer's intent exceeded your brand's ability to convert it.
What to look for: Stage-by-stage funnel conversion mapped to revenue lost at each drop-off point. Prioritize the stages with the highest revenue impact, not just the lowest conversion rates.
Q9. Are we measuring the right thing with our ad spend?
ROAS is not a business metric. It's a channel metric — useful for comparing campaigns within a channel, not for evaluating whether paid media is actually growing the business. The right metric is MER: Marketing Efficiency Ratio. Total revenue divided by total marketing spend. It tells you whether the whole machine is working, not just the campaign you're currently optimizing.
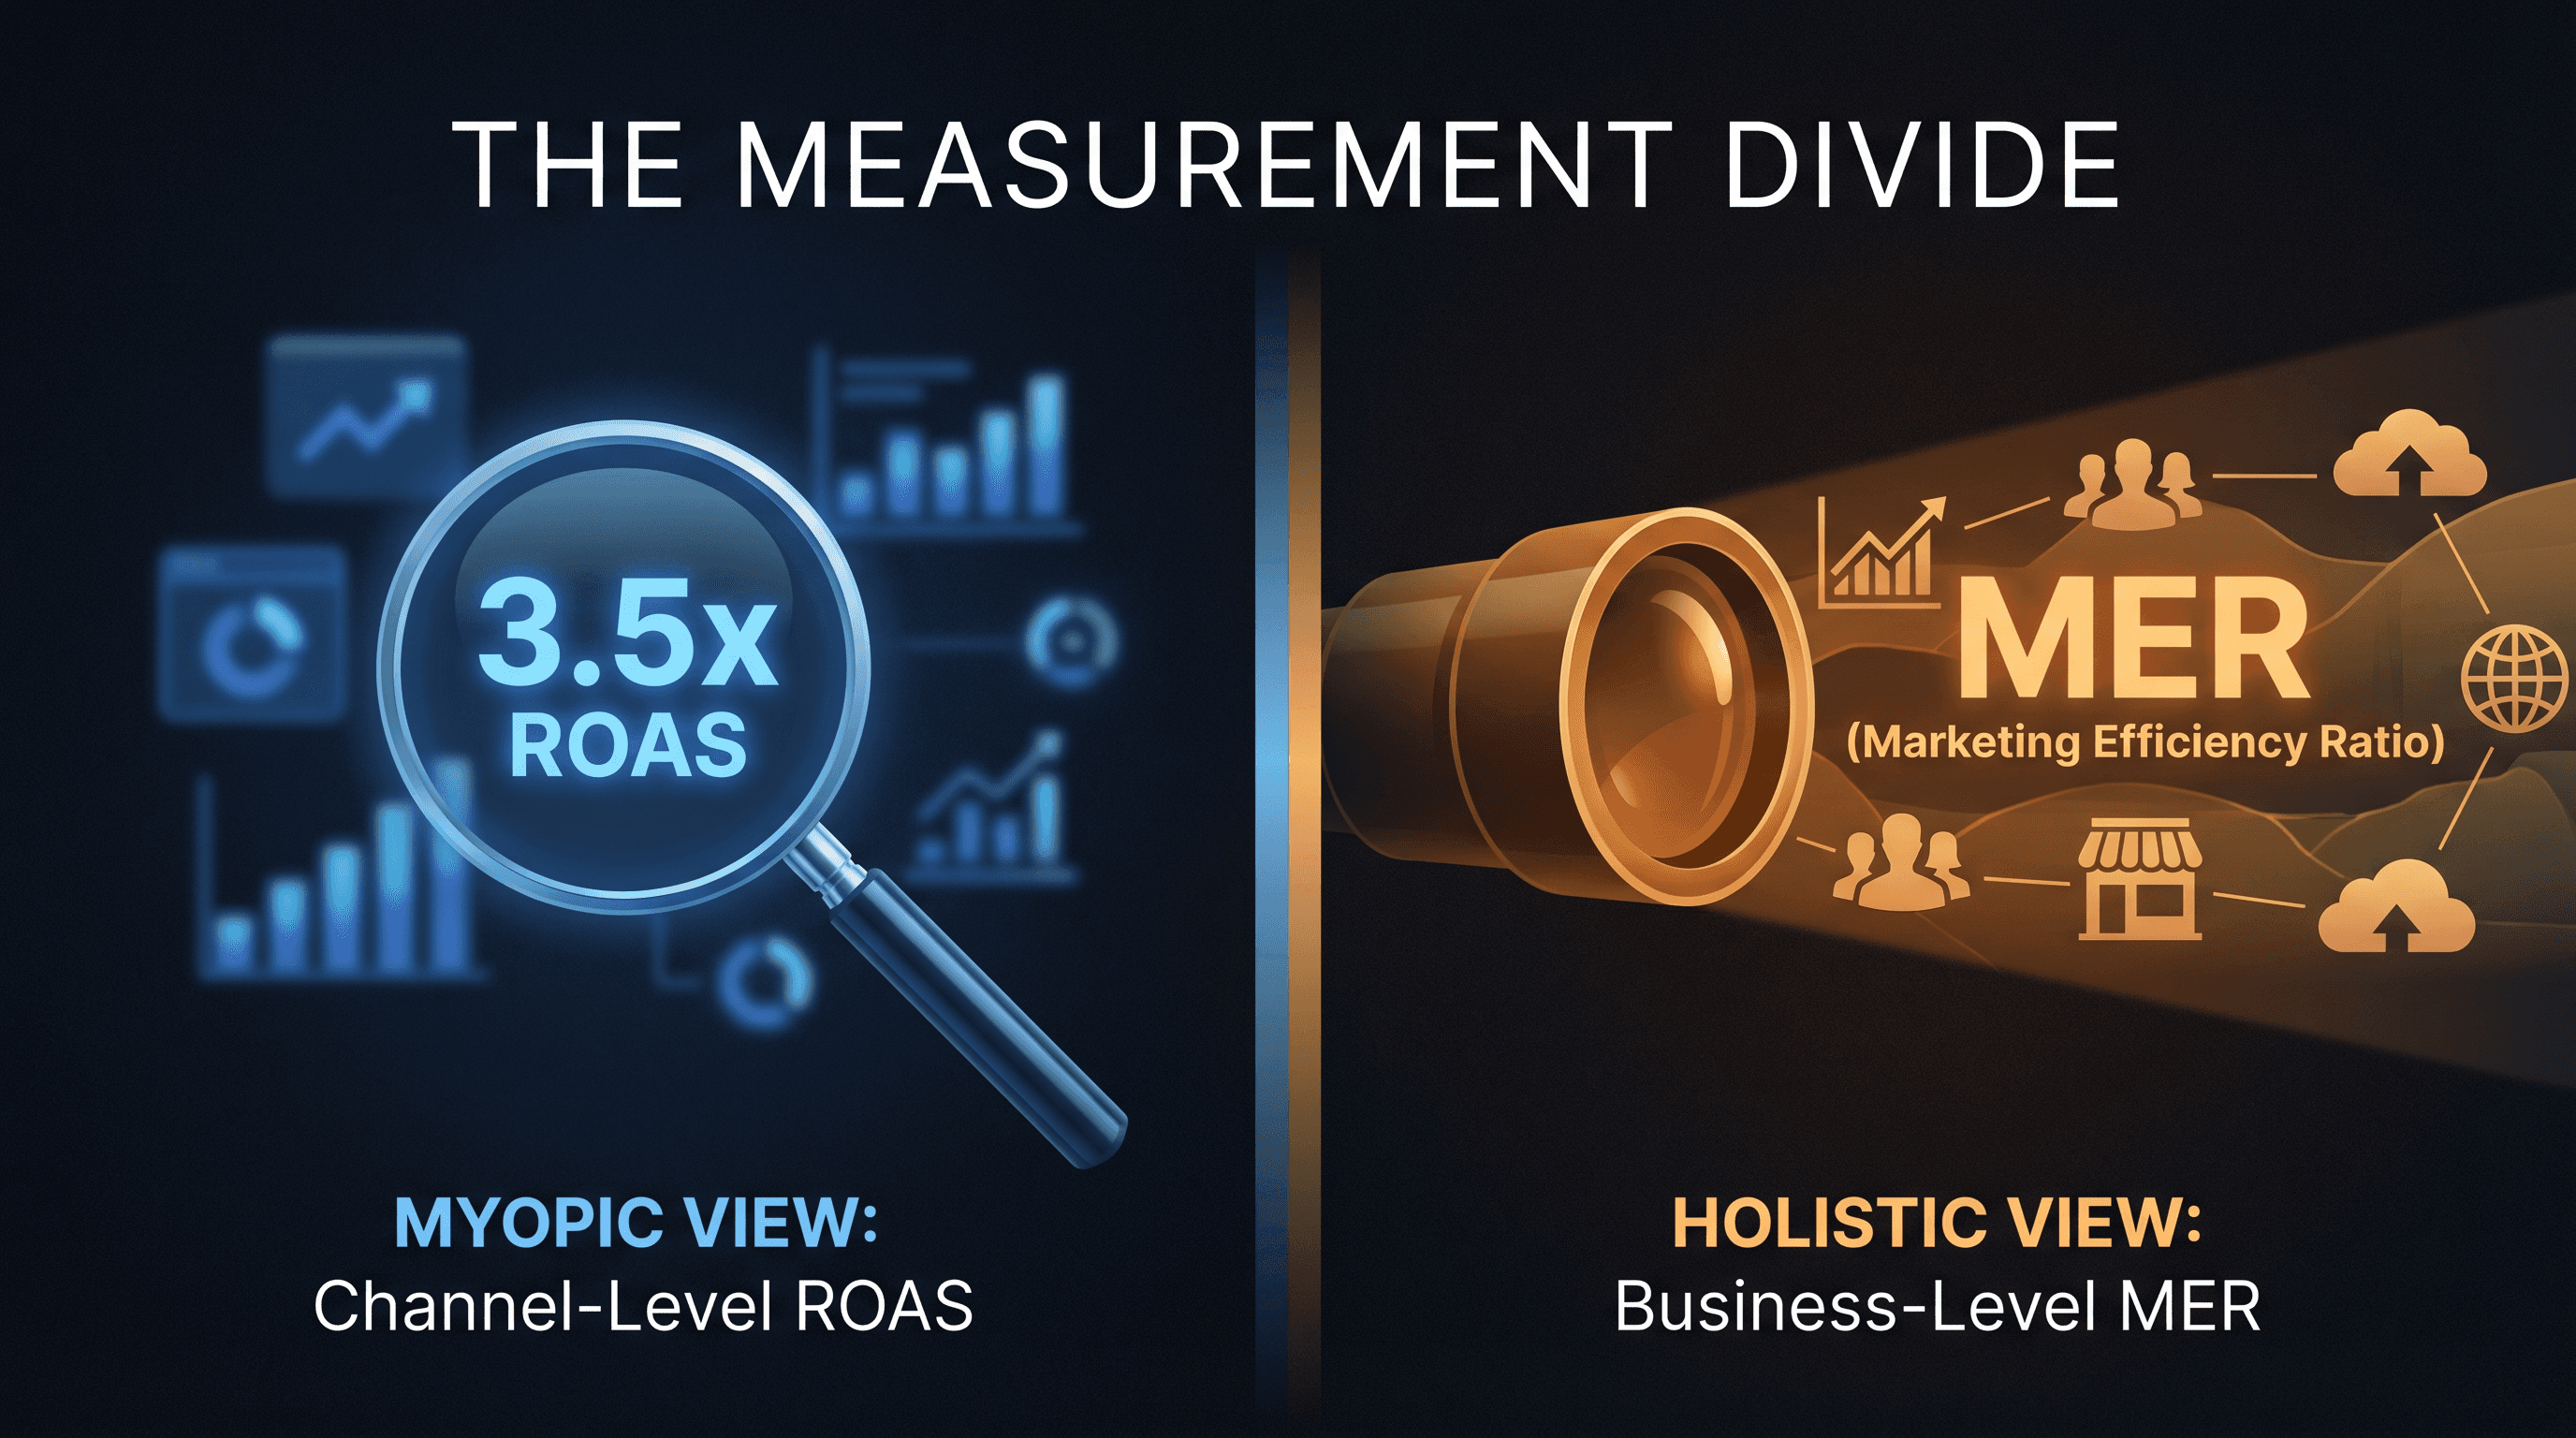
Brands that optimize for ROAS in isolation often achieve it at the expense of incrementality — scaling campaigns that look efficient but are largely capturing demand that would have converted anyway.
What to look for: MER trend month-over-month, broken down by paid vs. organic. Compare MER across periods with different spend levels. If MER improves when you pull back spend, you may be over-investing in attribution noise.
Q10. What does our data not know — and are we filling those gaps?
This is the most underrated question on the list. Every dataset has blind spots: offline touchpoints, word-of-mouth attribution, the influence of organic content that never gets credited, cross-device journeys that break tracking. The brands that make the best decisions aren't just the ones with the best data — they're the ones who know where their data ends and their judgment needs to begin.
Naming your data gaps isn't a weakness. It's epistemically honest — and it's the only way to build a decision-making process that accounts for what you don't know.
What to look for: Attribution model gaps (last-click vs. data-driven vs. multi-touch), survey-based attribution ("How did you hear about us?"), first-party data coverage rate across your customer base.
Predictable Growth Starts Here
These 10 questions aren't rhetorical. Each one maps to a specific data point, a specific decision, and a specific growth lever. Together, they form the diagnostic framework that separates brands that report on performance from brands that drive it.
If you don't have clean answers to all 10 — that's the finding.
The data is there. The questions just need asking.
Where does AccessFuel fit into this?
AccessFuel is an AI-powered e-commerce marketing platform that helps brands centralize, enrich, and activate their customer data. If you’re ready to see what enriched data can do for your marketing, book a demo and see what your data has been trying to tell you.
Frequently Asked Questions
What data do I need to answer these questions?
Most answers live inside your existing ecommerce platform (Shopify, WooCommerce), ad accounts, and email platform. The challenge is usually stitching them together, not sourcing them.
How often should we run this audit?
At minimum, quarterly. For fast-growing brands, monthly cohort reviews and weekly funnel checks are standard practice.
What's the difference between ROAS and MER?
ROAS measures revenue generated per dollar spent on a specific channel or campaign. MER measures total revenue divided by total marketing spend — a holistic efficiency view. MER is the more reliable business health indicator.