CAC Keeps Rising... How Do I Build a Profitable Growth Model?

TL;DR
Rising CAC isn’t just a media buying problem. It is a growth architecture problem.
Brands that focus exclusively on lowering CAC are solving the wrong equation. The real question is whether the customers you're acquiring generate enough value to justify what you paid.
Profitable growth is built on three interconnected gears: Acquisition Precision, Retention Depth, and Revenue Density. All three must turn together.
Most brands lack the data infrastructure to see which customers are worth acquiring, which ones are churning, and where revenue density is weakest. That is the root cause.
The brands winning in 2026 are not the ones with the lowest CAC. They are the ones with the highest clarity on what every acquired customer is actually worth.
The Uncomfortable Truth About Rising CAC
Here is the conversation happening in every DTC brand's Slack right now:
"CAC is up 30% year over year. ROAS is compressing. The CFO wants answers. The media buyer says CPMs are to blame. The growth lead says creative is fatiguing. The CEO says we need to get more efficient."
Everyone is partially right. None of them are solving the actual problem.
Rising CAC is real. Meta CPMs have climbed steadily since 2021. Google's auction density keeps increasing. TikTok's ad ecosystem is maturing and getting more expensive. Privacy changes have degraded targeting precision across every major platform. These are structural headwinds. They are not going away.
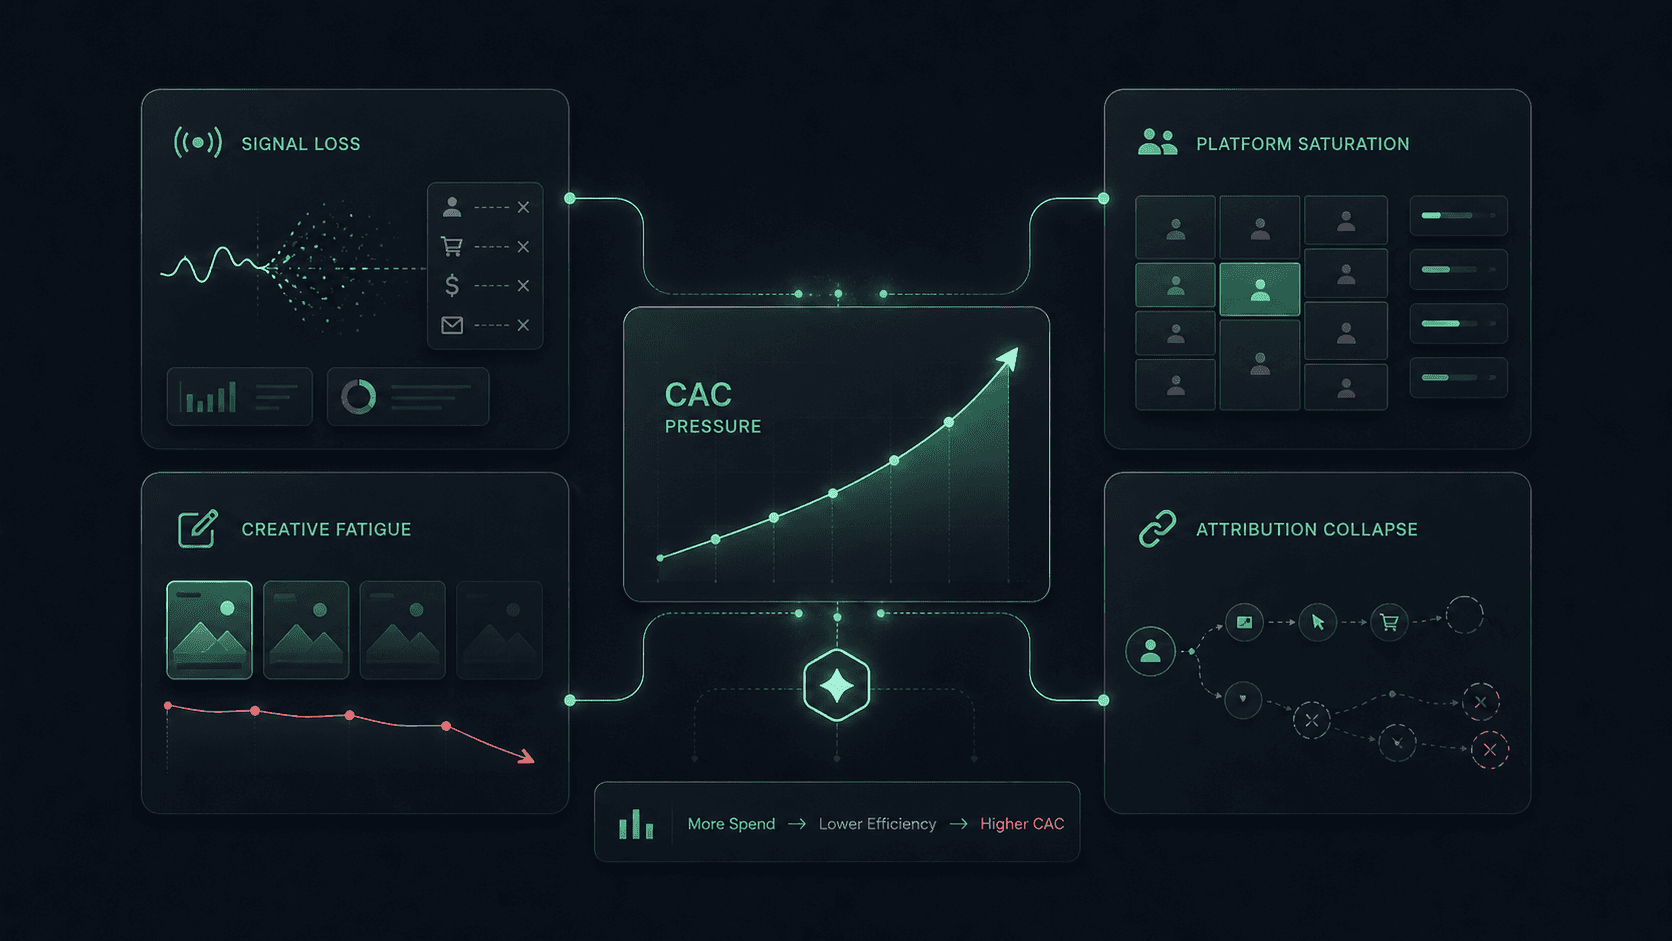
But here is what most brands miss: CAC is an output, not an input. You do not control it directly. You influence it through the quality of your targeting, the relevance of your creative, and the structural efficiency of your growth model. The brands that are still growing profitably in 2026 did not find some secret hack to lower CPMs. They built a system that makes rising CAC survivable.
The question is not "how do I lower CAC?" The question is: "How do I build a growth model where rising CAC does not kill profitability?"
That is a fundamentally different problem. And it requires a fundamentally different approach.
Why "Just Lower CAC" Is the Wrong Goal
Let's start with the math.
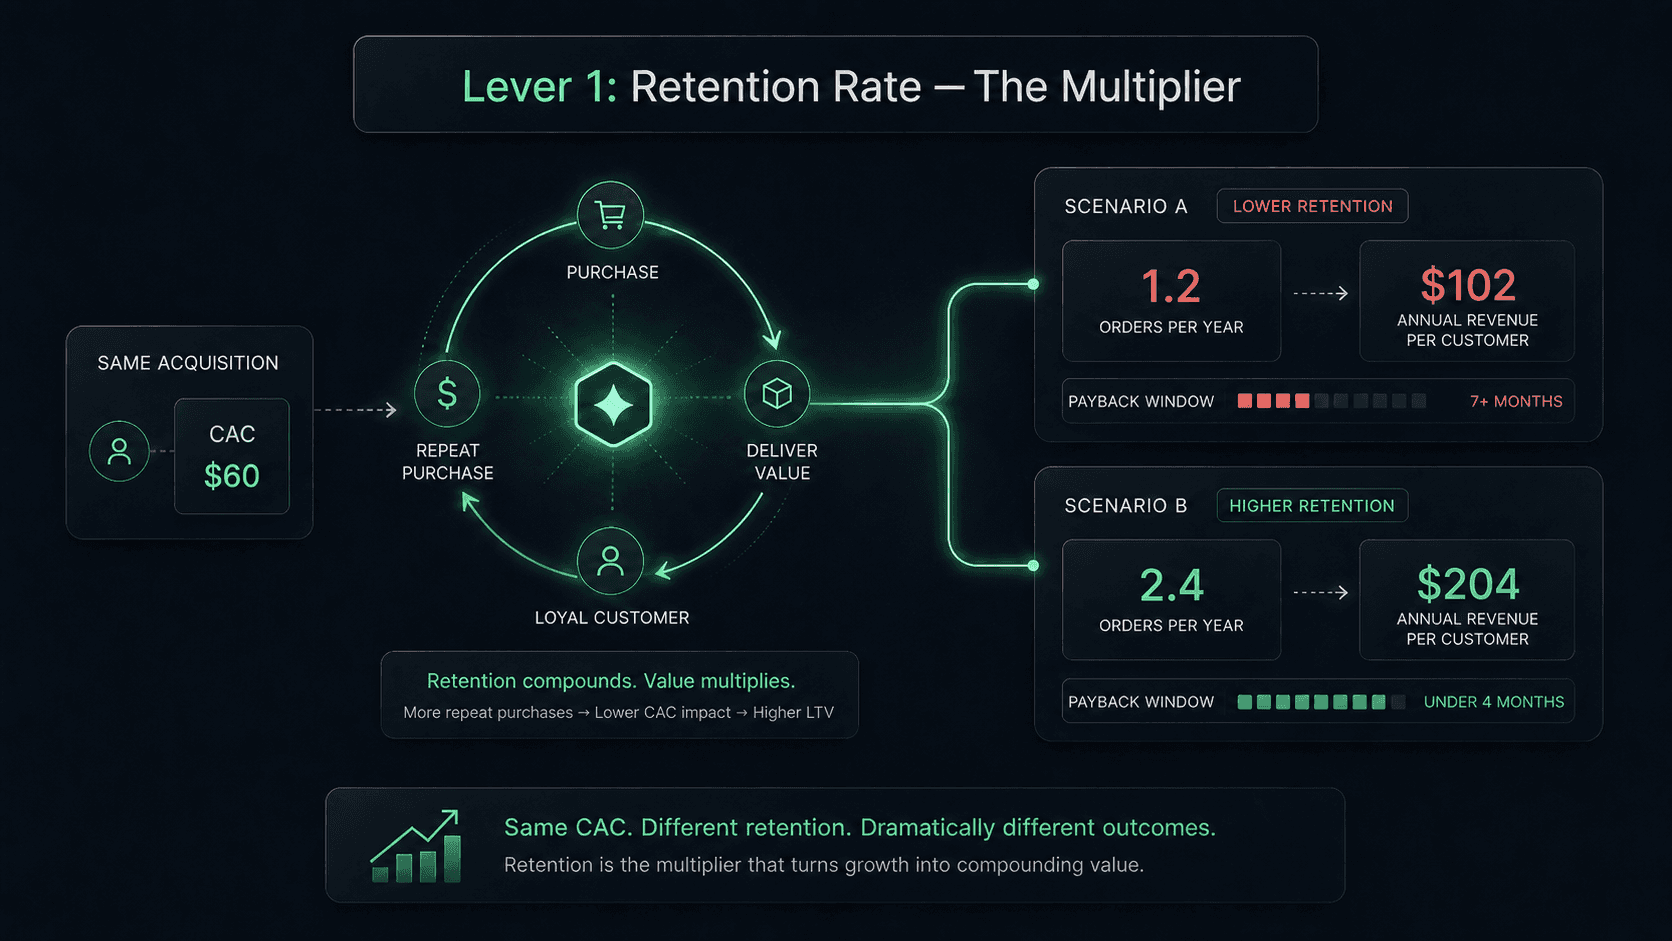
If your CAC is $40 and your average customer generates $45 in lifetime value, you have a 1.13x CAC:LTV ratio. That is barely profitable. A 10% increase in CAC wipes you out.
If your CAC is $60 and your average customer generates $240 in lifetime value, you have a 4x CAC:LTV ratio. CAC could double and you would still be profitable.
The first brand has a CAC problem. The second brand has a growth engine.
The difference is not how much they spend on acquisition. It is what happens after the acquisition. The first brand optimizes for cheap first purchases and hopes for the best. The second brand knows exactly who they are acquiring, what those customers are worth over time, and how to deepen that value systematically.
This is why "just lower CAC" is a trap. It focuses all energy on one variable in an equation that has three. You can lower CAC to zero and still lose money if the customers you acquire never come back.
The Three Gears of Profitable Growth
Profitable growth is not a single metric. It is a system. Think of it as three interlocking gears. If any one of them stops turning, the whole machine stalls.
Gear 1: Retention Depth
Retention is not a "nice to have." It is the structural foundation of profitable growth. Every percentage point of retention improvement compounds across your entire customer base. A brand with 40% repeat purchase rate needs radically less acquisition spend than a brand with 15%.
But retention is also one of the most poorly measured areas in ecommerce. Most brands look at overall repeat purchase rate as a single number. The operators who are winning look at retention by cohort, by acquisition channel, by product category, and by customer segment.
Why? Because not all retention is equal. A customer who comes back to buy the same $15 consumable every 60 days is retained, but their revenue contribution is very different from a customer who upgrades to a higher-tier product and adds complementary items each time.
Retention depth means understanding not just whether customers come back, but how their behavior evolves over time.
Key questions to audit Gear 1:
Do you measure retention by cohort and acquisition source, or as a single blended number?
Can you identify which product or category a customer first purchased and how that correlates with long-term retention?
Do you know at what point in the customer lifecycle the highest churn risk occurs?
Gear 2: Acquisition Precision
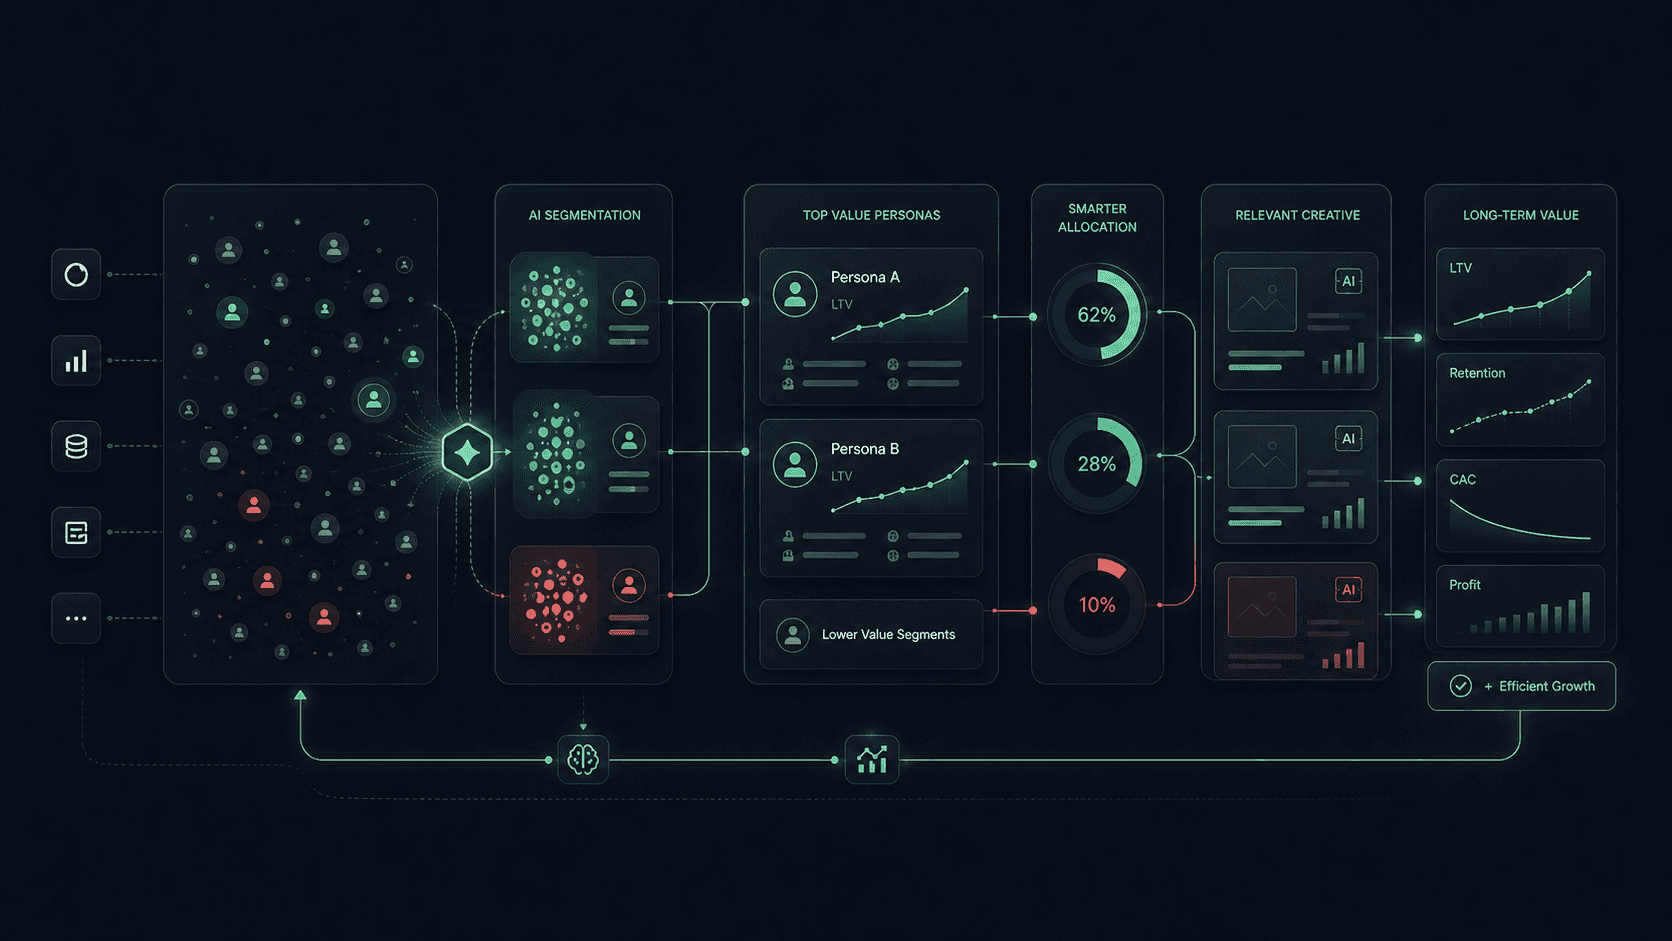
This is not about spending less. It is about spending smarter. Acquisition precision means knowing which customer segments are worth acquiring before you spend the media dollars, not after.
Most brands acquire broadly and then sort out who's valuable later. The profitable ones do it in reverse. They start with their highest-value customer segments, build lookalike audiences from those segments, and concentrate spend where the expected LTV justifies the CAC.
The difference between a $40 CAC customer who churns after one order and a $40 CAC customer who buys 6 times over 18 months is not the CAC. It is who you targeted.
Key questions to audit Gear 2:
Do you know which customer segments have the highest LTV before you build audiences?
Are your lookalike seeds built from high-value customers or from everyone who ever purchased?
Can you see CAC by segment, not just CAC as a blended average?
Gear 3: Revenue Density
Revenue density is the least discussed gear, and arguably the most powerful. It answers the question: for each retained customer, how much revenue are they generating per transaction and per year?
This is where AOV strategy, cross-sell and upsell execution, and pricing optimization live. A brand that retains 35% of customers with a $55 AOV is in a very different position than a brand that retains 35% of customers with a $120 AOV. Same retention rate. Wildly different economics.
Revenue density is how you make the math work even when CAC rises. If your average customer's annual value increases from $120 to $200, you just gave yourself 67% more room to absorb CAC increases without sacrificing profitability.
Key questions to audit Gear 3:
What is your AOV trend by cohort over the past 12 months? Is it rising or flat?
Which product combinations drive the highest post-purchase AOV lift?
Are you running segmented promotions, or the same offer to every customer regardless of value tier?
The Real Problem: You Cannot Optimize What You Cannot See
Here is where most growth model conversations go sideways.
Operators intellectually understand that acquisition precision, retention depth, and revenue density all matter. The problem is not awareness. The problem is visibility.
Most ecommerce brands have their customer data in Shopify, their email engagement in Klaviyo, their ad performance in Meta and Google, their web analytics in GA4, and their financial data in a spreadsheet. Nothing talks to anything else. The data exists, but it is fragmented across five or six tools that were never designed to give you a unified view of customer value.
So what happens? Brands default to the metrics they can see: blended CAC, blended ROAS, blended repeat purchase rate. All averages. All hiding the segment-level truth that would actually inform better decisions.
You cannot build acquisition precision if you do not know which segments are high-value. You cannot deepen retention if you cannot see where customers are churning and why. You cannot increase revenue density if you cannot identify which customers have expansion potential and which are already maxed out.
You do not have a CAC problem. You have a visibility problem.
The growth model breaks down not because the strategy is wrong, but because the data infrastructure underneath it does not support segment-level decision-making. And no amount of creative testing or bid optimization will fix a structural visibility gap.
Building the Model: A Practical Framework
Enough theory. Here is how operators are building profitable growth models in practice.
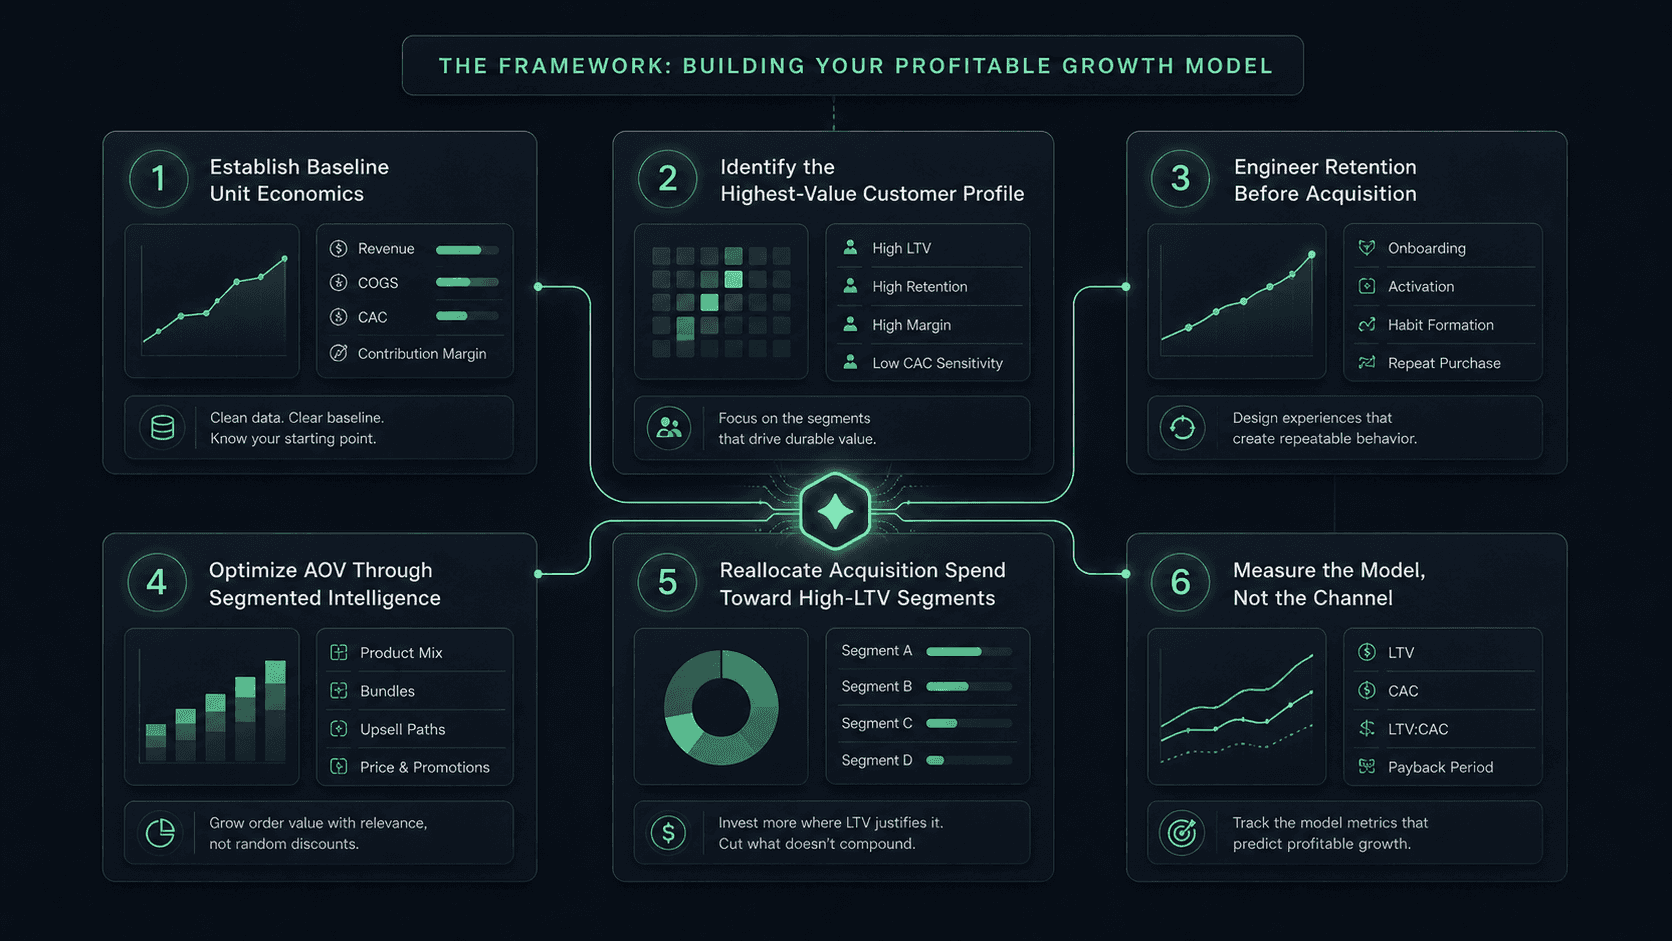
Step 1: Establish Your Unit Economics Baseline
Before you change anything, you need to know where you actually stand. Not blended averages. Segment-level truth.
Calculate the following for your top 3-5 customer segments (by value tier, acquisition source, and product category):
CAC by segment
90-day, 180-day, and 365-day LTV by segment
Repeat purchase rate by segment
AOV trend by segment
If you cannot calculate these numbers by segment, that is your first problem to solve. Blended metrics will mislead you.
Step 2: Identify Your Highest-ROI Acquisition Targets
With segment-level unit economics in hand, identify which customer segments have the strongest CAC:LTV ratio. These are your priority acquisition targets.
Build your paid media audiences from these segments. Use first-party purchase behavior, product affinity, spend level, and lifecycle signals to create lookalike seeds that actually represent your best customers, not just your most recent ones.
Step 3: Map Your Retention Gaps
Look at cohort-level retention data. Where do customers drop off? After the first purchase? After the second? At the 90-day mark?
For each drop-off point, ask: what is the cost of that churn in terms of lost LTV? And what would a 5% improvement in retention at that specific stage be worth in annualized revenue?
This turns retention from a vague "we should do better" into a quantified opportunity with a clear dollar value.
Step 4: Attack Revenue Density Segment by Segment
Not every customer should get the same upsell. Not every customer responds to the same offer.
Segment your customers by current AOV tier and purchase frequency. For each segment, identify the most natural revenue expansion path: is it a higher-tier product? A complementary add-on? A subscription conversion? A bundle?
The key insight: revenue density initiatives should be personalized by segment, not broadcast to the entire list. A $30 AOV customer and a $150 AOV customer need different expansion strategies.
Step 5: Build the Feedback Loop
This is the step most brands skip, and it is the most important one.
A profitable growth model is not a set-it-and-forget-it framework. It is a system that learns. Every acquisition campaign should feed data back into your segmentation. Every retention cohort should inform your acquisition targeting. Every revenue density initiative should update your LTV models.
The flywheel works when the gears inform each other. Acquisition data tells you who is worth retaining. Retention data tells you who is worth acquiring more of. Revenue density data tells you how much you can afford to spend on both.
What This Looks Like in Practice
Brand A is spending $200K/month on paid media. Blended CAC is $52. Blended ROAS is 2.8x. The board is unhappy.
After building segment-level visibility:
Segment 1 (Premium buyers): CAC $68, 12-month LTV $320. CAC:LTV = 4.7x.
Segment 2 (One-time discount seekers): CAC $38, 12-month LTV $42. CAC:LTV = 1.1x.
Segment 3 (Mid-tier repeaters): CAC $45, 12-month LTV $165. CAC:LTV = 3.7x.
The blended CAC of $52 is meaningless. What matters is that 35% of acquisition spend is going to Segment 2, which is barely breaking even. Reallocating that spend toward Segments 1 and 3 does not lower CAC. It makes the entire growth model profitable.
This is the shift. Not cheaper acquisition. Smarter acquisition, informed by customer intelligence.
The Metrics That Actually Matter
If you are rebuilding your growth model, here are the metrics to track at the system level:
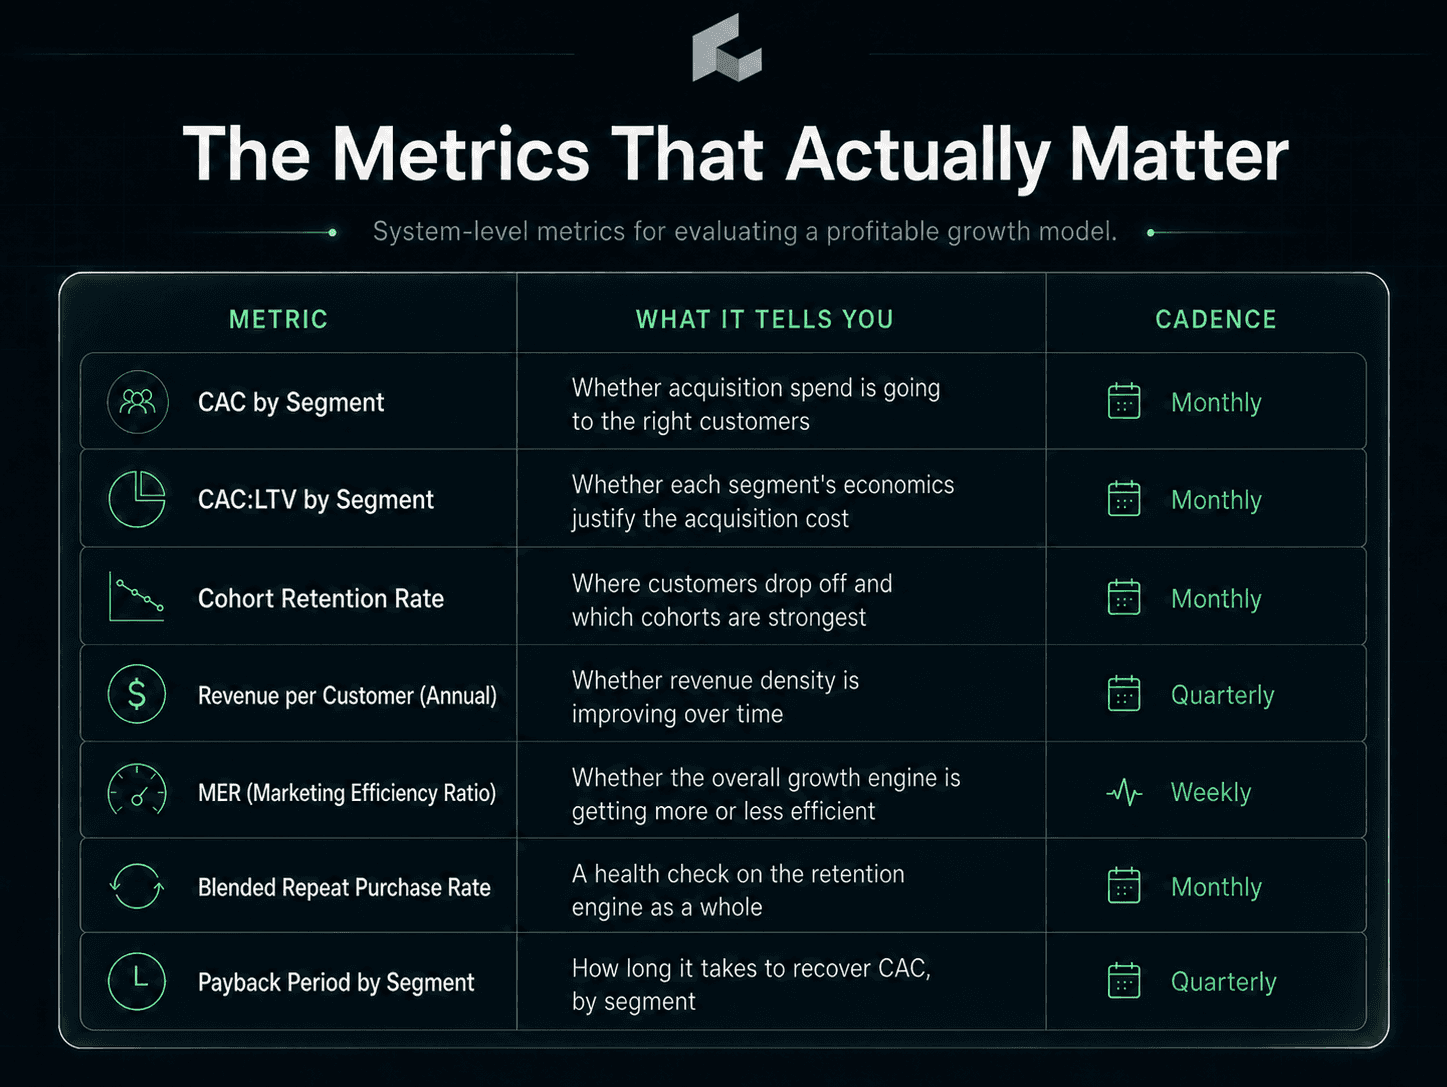
The key: these metrics form a connected system. MER is your bird's-eye view (as covered in our previous piece on MER vs. ROAS vs. CAC). CAC:LTV by segment is your decision-making layer. Cohort retention and revenue density are your operational levers.
FAQ
What is a good CAC:LTV ratio for ecommerce?
A 3:1 ratio is the widely accepted benchmark for healthy ecommerce economics. That means every dollar spent on acquisition generates three dollars in lifetime customer value. Below 2:1 signals a profitability risk. Above 4:1 suggests room to invest more aggressively in growth.
Why is my CAC rising even though my creative is performing well?
Creative performance is only one input. Rising CPMs across ad platforms, increased auction competition, and degraded targeting from privacy changes all push CAC up regardless of creative quality. The structural answer is to improve what happens after acquisition, not just optimize the acquisition itself.
How do I calculate LTV by customer segment?
Start by segmenting customers by acquisition source, first product purchased, or value tier. For each segment, calculate total revenue generated per customer over 90, 180, and 365-day windows. The segment-level view reveals which customers are genuinely valuable and which are inflating your blended averages.
Is lowering CAC or increasing LTV more impactful?
In almost every scenario, increasing LTV has a larger and more durable impact on profitability than lowering CAC. CAC is subject to market forces you cannot fully control (CPMs, competition, privacy). LTV is influenced by retention, revenue density, and customer experience, all of which are within your operational control.
What role does data infrastructure play in building a profitable growth model?
It is the foundation. Without unified customer data, segment-level visibility, and connected analytics, brands are stuck making decisions on blended averages. Building a profitable growth model requires seeing acquisition, retention, and revenue density at the segment level, which demands a data layer that connects commerce, marketing, and customer intelligence.